With the rise in digital transformation, the sheer availability of data has been fuelling data driven economies. According to the International Data Corporation (IDC) we human beings produce data at a mind bending pace which reached around 59 zettabytes (ZB) of data in the year 2020 alone. So, though the data production is at humongous rate, there is a lack of newly created unique data and not all the users are able to access the data. The ratio to unique data created to replicated data stands around 1:9. The report by IDC also suggests that this ratio will change to 1:10 by the year 2024. Additionally, handling and processing personal data among these massively produced data have several legal and ethical constraints. This creates data scarcity in some domains and can slow down the progress of business development. Furthermore, there is lack of access to high variance datasets during training which affects the generalisation capacity of the model during deployment. Therefore, Synthetic data is the alternative to go source for business and companies to accelerate their progress using data and AI.
Synthetic data generation, also known as data cloning, produces synthetic data that closely resembles the real data statistically and mathematically. However, depending upon the synthetic data generation process the data quality may not match the original data or may fail to capture different relationships between data features. This can be problematic for stakeholders regarding the quality and reliability of the results they would obtain while using the synthetic data. Therefore, we need metrics that can help both the data generators and the users to understand the quality of the synthetic data. For example, how well the synthetic data captures the inter-dependency between features and context along with the statistical properties of the real dataset. The other concern could be related to privacy which is seeking an answer to how well can the synthetic data preserve the privacy so that the sensitive information contained in the real data do not leak. This could be discussed in a subsequent blog.
At Clearbox AI, we assess our synthetic data quality using four robust metrics which are discussed below.
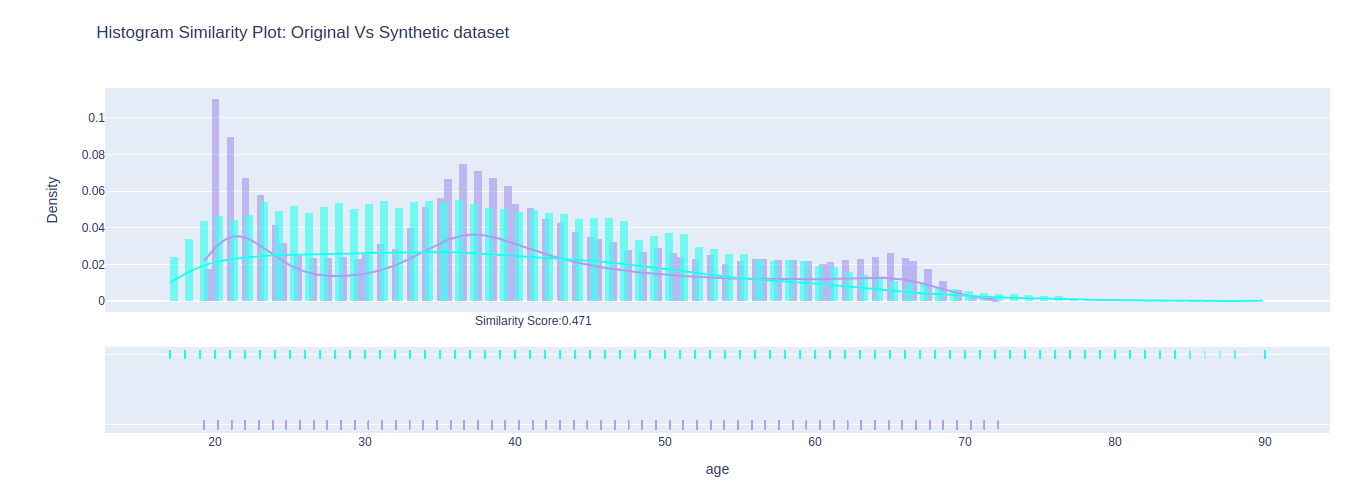
Histogram Similarity Score
The similarity score between histograms depicts the overlap between real data and the synthetic data. It ranges from 0 to 1 where 1 stands for the perfect overlap. The decision for the similarity score depends upon the type of distance measure. This score can provide a quick glimpse of how well the synthetic data matches the real data. We can capture the feature wise similarity as shown in Figure 1 below:

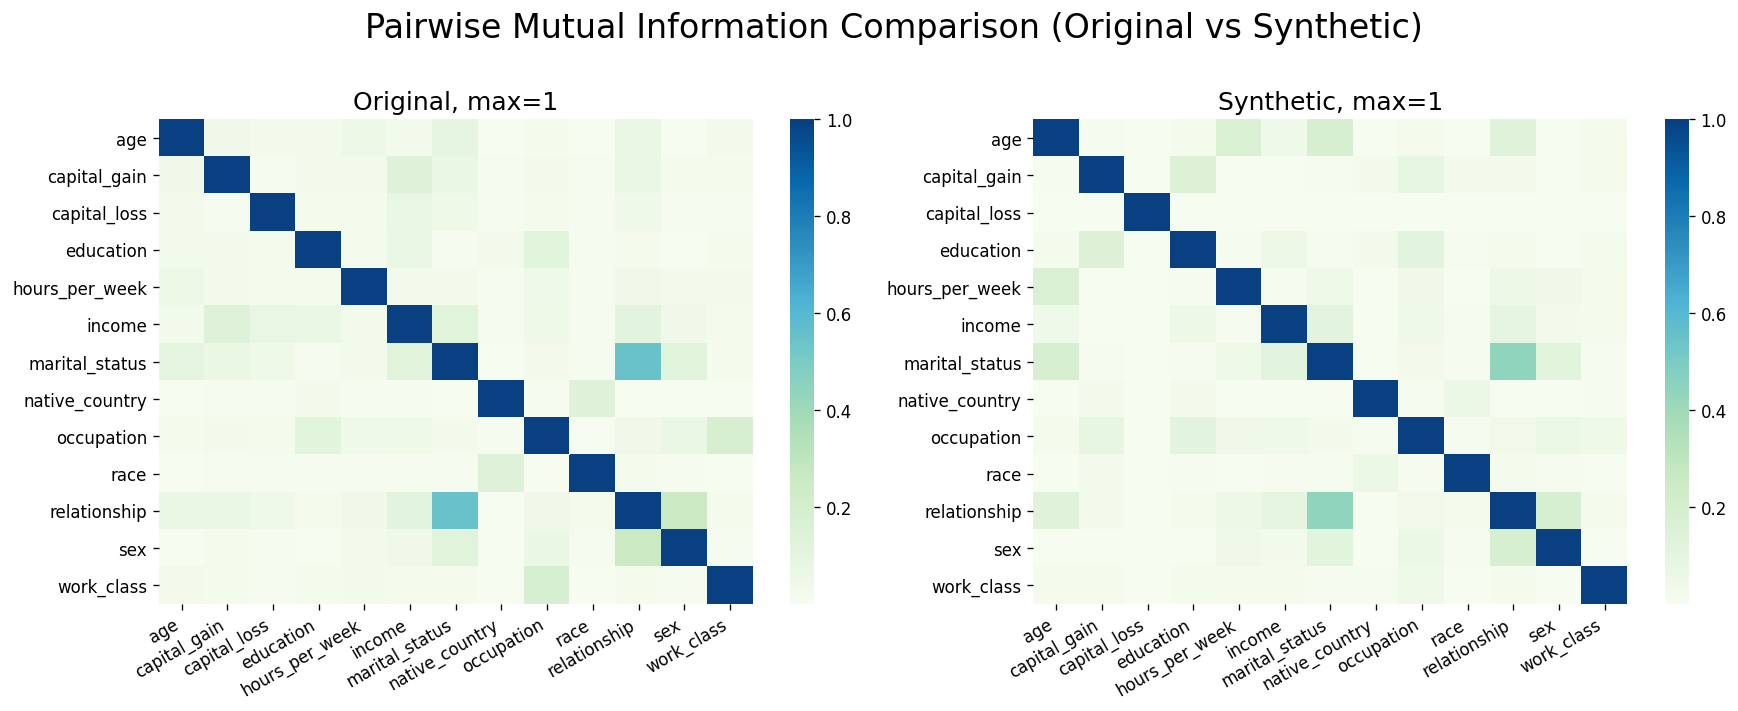
Pairwise Mutual Information
Unlike the histogram similarity score, the mutual information depicts the mutual dependencies between different data features. Mutual information between two variables is the quantification of information that can be used to explore the dependencies between the two random variables. It depends on the information theory and the amount of information is quantified in bits or shannon. A good synthetic data will maintain the same kind of mutual dependency between features when compared with the features from the real data. The heat map between features of the synthetic data can be visualized below in Figure 2.

TSTR or predictive capacity
TSTR stands for Training on Synthetic data and Testing on Real Data. This provides the quality assessment of the synthetic data by training on some machine learning model using the synthetic data and then testing on the real data. Then, the ratio between accuracy obtained from training on synthetic data and accuracy obtained from training on original data is calculated to see the predictive capacity. The test is always done on the original data.
PC = Accuracy of model trained on synthetic data : Accuracy of model trained on original data.
Generally, we consider the score of PC < 0.9 as having synthetic data with inferior quality and PC > 0.9 as having synthetic data with good quality.
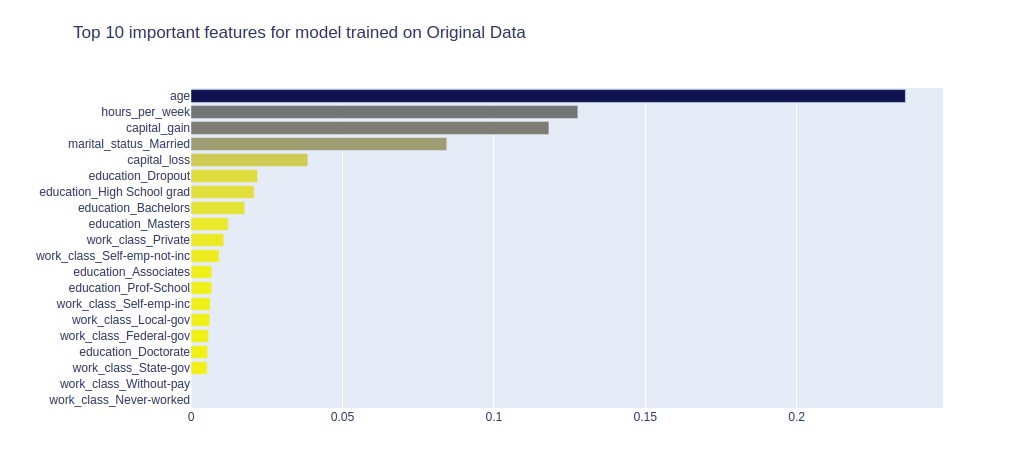
Stability of Feature Importance
The other metric that can provide the quality check of the synthetic data is by looking at the order of feature importance. We compare the order of feature importance obtained from models trained on synthetic data and real data. A good quality of synthetic data would help yield the same order of feature importance. The Figure 4 below depicts the comparison of order of feature importance between real and synthetic data features.

These metrics can provide us a good quality assessment of the synthetic data but there are contexts where synthetic data would fail to capture key data points such as outliers that are key in applications like anomaly detection. So, quality should also be assessed based on the context or how well the synthetic data captures the context. Sequential time series datasets are one of the examples where it is important to capture temporal dependencies between events, frequency and the final time value. For these kinds of datasets, auto-correlation could be a better metric to assess the quality of the synthetic data.
