
One of the most crucial phases within an ML pipeline for a data scientist is that of testing their newly trained ML model. During this stage it is important to evaluate the behaviour of the model with data that differ from the training set, by simulating scenarios similar to those of the production phase (when the model will be deployed). Most of the metrics evaluated at this stage (such as accuracy for classification problems or mean squared error, MSE, for regression problems, to name a few) only provide an overview of the average performance of a model. This is due to the fact that the said metrics are calculated on the entire dataset without particular regard for the heterogeneity of the data themselves.
Heterogeneous data lead to heterogeneous performance
Oftentimes, in reality, within the same dataset very different data groups coexist, with the consequence that an ML model will perform better on some data segments and worse on others. Identifying these groups of data and evaluating the performance of a model on each of them are therefore very important. This analysis, in fact, allows users to anticipate possible 'unexpected' behaviours by the model once deployed, thereby providing the option for users to intervene earlier. But what is the best possible way to identify such data segments and perform this analysis?
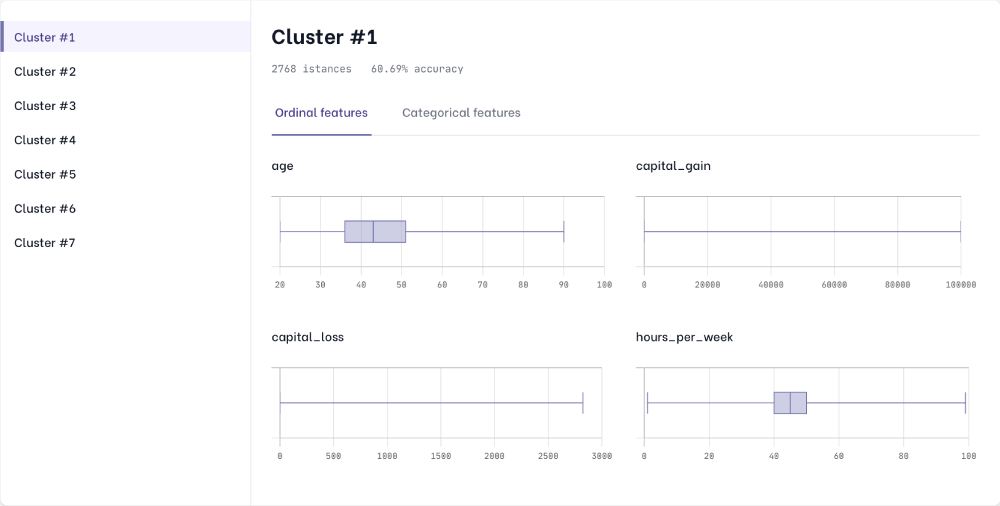
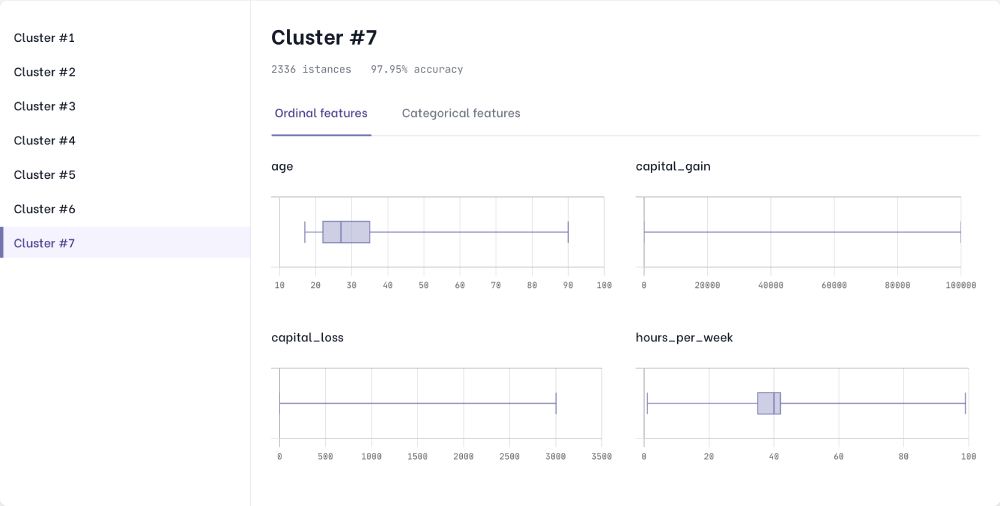
Our tool, AI Control Room, uses its engine, based on a generative model, to automatically identify clusters of data, and evaluates the performance of the model on each of them. The latent space generated by our engine allows us to divide datasets into data segments in an optimal and robust way, using state of the art clustering algorithms. Each cluster found represents a different group of data, characterised by certain combinations of value ranges for both numeric and categorical features. The next logical step is to use the newly found clusters to evaluate the machine learning model, applying the standard metrics mentioned at the beginning of this article on each of the distinct groups identified. Understanding whether different clusters have significant differences in metrics leads to understanding the strengths and weaknesses of your ML model. Data segments with poor performance can be analysed in terms of features,to understand if these points are associated with a high aleatoric uncertainty or by a poor model decision boundary.
Next steps in your analysis
Conducting an analysis of this type helps to prevent possible anomalous behaviour in production, by intervening in advance on the ML model or on the training dataset. In the first case it is possible, for example, to perform a tuning of the hyperparameters used in the training phase, trying to mark the decisional boundaries of the model to increase the level of performance even in the clusters where it initially behaved worse. Addressing the problem from the point of view of data, on the other hand, means having to modify the initial dataset used for training. Increasing the number of points in clusters with poorer metrics, by balancing the dataset, can help train better ML models. In the event that no further data is available, synthetic data can be used, generating ad-hoc data points in the clusters of interest through our tool..We will shed more light on synthetic data in subsequent blog posts, stay tuned!
